Total consumption
969.89 kWh
Recorded electricity usage


This is our 2025 sustainability update, built on measurable metrics: total energy use, estimated CO₂ impact, and ESG assessment results with a detailed theme breakdown. We also document a local action—4 Ficus trees planted—and provide transparent, approximate CO₂ uptake ranges over time. Our goal is simple: publish the numbers, learn from them, and turn them into better implementation in 2026.
At HOKEN TECH we publish a yearly sustainability update to share transparent, data-driven information about our energy consumption, CO₂ impact, and ESG (Environmental, Social, Governance) progress. We do this for accountability toward customers and partners — and because measurement is the foundation for meaningful improvement.
We operate in a digital-first environment (including blockchain-based components). We’re aware that technology choices can have environmental implications, which is why we monitor our footprint and continuously improve our processes year over year.
For 2025, our dashboard reports a total energy consumption of 969.89 kWh, with an estimated cost of €135.78. The associated footprint is 376 kg CO₂, reported as equivalent to 28.1 trees needed for absorption.
For accessibility, the dashboard also provides equivalences: this impact is comparable to a light bulb left on for 2,020 days, or driving 2,688.0 km with similar CO₂ emissions.
Total consumption
969.89 kWh
Recorded electricity usage
CO₂ produced
376 kg
Estimate linked to consumption
Estimated cost
€135.78
As reported by the dashboard
Tree equivalent
28.1
To absorb the reported CO₂
In 2024 we reported approximately 311 kWh, about 121 kg CO₂, and an equivalence of 9 trees for absorption. In 2025, the reported values are higher (roughly +212% vs 2024 for both energy and CO₂). This increase can be driven by multiple factors (e.g., higher operational activity, different measurement scope, or infrastructure changes).
| Metric | 2024 | 2025 | Change |
|---|---|---|---|
| Energy (kWh) | 311 | 969.89 | +212% |
| CO₂ (kg) | 121 | 376 | +211% |
| Tree equivalent | 9 | 28.1 | +212% |
| Estimated cost (€) | 43,67 | 135.78 | +211% |
Percent changes are computed vs 2024 values.
What matters most is that we measure, publish, and turn insights into actions — with clear priorities and accountability.
The new sustainability assessment places HOKEN TECH at an overall maturity level of “Advanced”. The headline ESG scores are:
Overall maturity level reported: Advanced.
The detailed breakdown highlights clear strengths (e.g., Mobility: 100%, Commercial transparency: 100%) and improvement areas we’re prioritizing (e.g., Circularity: 50%, Water use: 65%, Human capital: 63%).
| Area | Theme | Score |
|---|---|---|
| E | Energy consumption | 81% |
| E | Water consumption | 65% |
| E | Circularity | 50% |
| E | Emissions & environmental impact | 80% |
| E | Waste management | 75% |
| E | Mobility | 100% |
| S | Information & transparency in commercial relationships | 100% |
| S | Supply chain | 79% |
| S | Human capital | 63% |
| S | Social capital | 89% |
| S | Customers | 90% |
| S | Innovation | 80% |
| G | Sustainability strategy & governance | 75% |
| G | Values, ethics & transparency | 70% |
| G | Training & continuous learning | 84% |
| G | Communication | 85% |
From a process standpoint, our strongest dimensions are planning and measurement, while the most challenging area is typically implementation — especially on the environmental side. This is valuable because it translates ESG from “statements” into an operational roadmap.
In 2024 we referenced:
| Framework | 2024 | Latest report | Status |
|---|---|---|---|
| UNI 134:2022 | “Excellent” (43–48) | “Excellent” (43–48) | up to date |
| SDGs (Agenda 2030) | Compatible with 11/17 | Compatible with 12/17 | up to date |
| GRI | 70% / 100% / 83% | 74% / 100% / 83% | up to date |
In the most recent report, the GRI compatibility is:
| Dimension | 2024 | Latest report | Δ |
|---|---|---|---|
| Environmental | 70% | 74% | +4 pp |
| Social | 100% | 100% | 0 pp |
| Governance | 83% | 83% | 0 pp |
This indicates an improvement in Environmental GRI coverage, while Social and Governance remain stable at a strong level.
In 2025 we planted 4 Ficus australis (small-leaf) as a tangible, local contribution alongside our measurement and governance work.
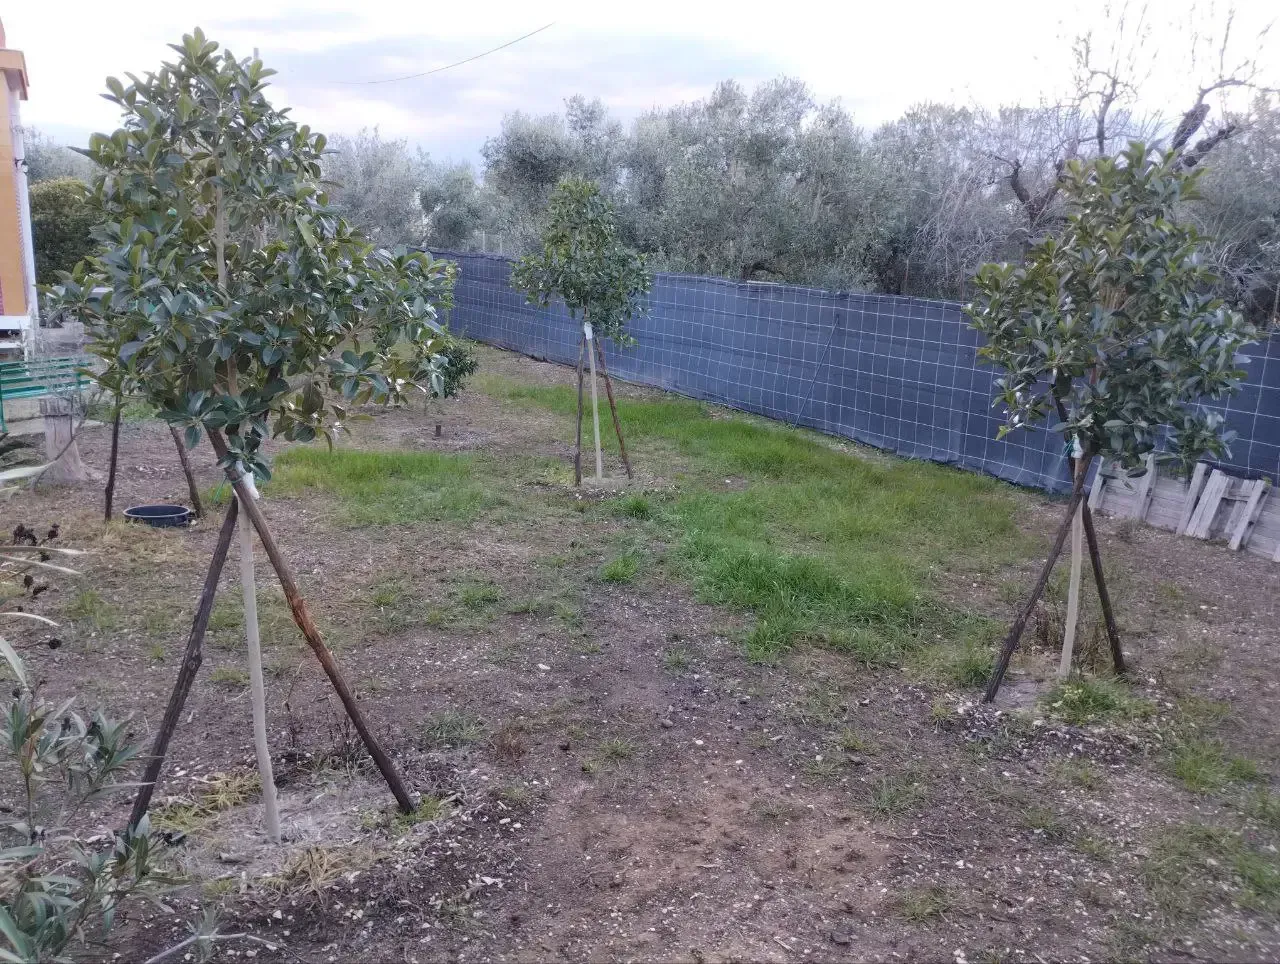
Because tree sequestration depends heavily on climate, age, survival rate, and maintenance, the numbers below are approximate, order-of-magnitude estimates. A common practical range for a small-to-medium urban tree once established is roughly 10–25 kg CO₂ per year.
The values below are indicative ranges. Actual sequestration depends on location, growth, survival rate and maintenance. We use a practical “once established” range of ~10–25 kg CO₂ per tree per year.
Trees planted (2025)
4
Annual uptake (once established)
~40–100 kg CO₂ / year
Central estimate (once established)
~60 kg CO₂ / year
| Horizon | Low scenario | Central scenario | High scenario |
|---|---|---|---|
| 10 years | ~0.32 t CO₂ | ~0.48 t CO₂ | ~0.82 t CO₂ |
| 20 years | ~0.72 t CO₂ | ~1.08 t CO₂ | ~1.82 t CO₂ |
| 30 years | ~1.12 t CO₂ | ~1.68 t CO₂ | ~2.82 t CO₂ |
Method (simple illustrative model): lower uptake in early years, then “once established” uptake thereafter. This is meant for communication and should not be used as a formal offset claim.
Based on the assessment insights, our 2026 focus areas are:
Circularity: stronger practices and metrics (assets, procurement, reuse).
Environmental implementation: turning plans and KPIs into owned, time-bound projects.
Human capital: strengthening training, growth, and people processes.
Digital for environmental sustainability: better tooling and automation to measure and reduce impact more granularly.
Hoken Tech’s Sustainability Report 2025 is a structured disclosure of the company’s environmental performance and ESG commitments. It summarizes key indicators such as energy consumption, CO₂ impact, and the results of ESG assessment frameworks. The goal is to improve transparency and help stakeholders understand progress year over year.
The report focuses primarily on the Environmental pillar (energy use, emissions, mitigation actions) and connects this to broader ESG measurement outcomes. It also includes the outcomes of standardized assessment approaches (e.g., sustainability ratings) to contextualize performance. This makes it useful both as a narrative and as a metrics-based document.
Energy consumption is typically tracked in kilowatt-hours (kWh) using utility bills, meter readings, and internal monitoring. The report consolidates these values to provide an annual total and often compares them to previous years. This helps identify trends, efficiency gains, and areas needing improvement.
CO₂ impact refers to the estimated greenhouse gas emissions associated with operations—commonly expressed as CO₂ or CO₂e (carbon dioxide equivalent). It is generally calculated by applying emission factors to activity data (like electricity consumption). Reporting CO₂ impact supports carbon management planning and decarbonization strategy.
Yes—based on the report’s emphasis on energy and CO₂ metrics, Hoken Tech’s approach is aligned with a carbon footprint reduction strategy. Typical actions include improving energy efficiency, optimizing operations, and supporting environmental initiatives. Reduction progress is assessed by monitoring year-over-year indicators.
The report aligns with widely recognized sustainability frameworks, including GRI (Global Reporting Initiative) and SDGs (UN Sustainable Development Goals), and references UNIQ 134:2022 as part of sustainability rating context. These frameworks help ensure disclosures are more comparable and credible. They also strengthen stakeholder confidence by using recognized reporting structures.
An ESG assessment is a structured evaluation of a company’s performance across environmental, social, and governance factors. It matters because investors, partners, and customers increasingly use ESG signals to evaluate risk, resilience, and long-term value. Including ESG assessments in the report makes performance easier to benchmark.
Trees support sustainability goals by contributing to carbon sequestration, improving local biodiversity, and enhancing environmental awareness. However, tree planting is generally best viewed as a supporting action, not a substitute for emissions reductions at the source. In the long term, trees can contribute meaningful cumulative CO₂ absorption when properly maintained.
Based on the estimates discussed, a Ficus can absorb roughly ~10–25 kg CO₂ per year per tree, depending on growth conditions and maturity. Over decades, this can accumulate substantially, especially across multiple trees. Real-world outcomes vary with climate, watering, soil, and survival rate.
Reduction means lowering emissions from operations (e.g., using less electricity or switching to lower-carbon energy). Offsetting means compensating for emissions via external projects (like reforestation or verified carbon credits). Strong sustainability strategies prioritize reductions first, then use offsets for residual emissions.
Most organizations publish and refresh sustainability metrics annually, with internal monitoring more frequently (monthly or quarterly) for operational control. Annual reporting supports consistent year-over-year comparisons and clear accountability. More frequent updates can be shared through blog posts or short ESG progress notes.
nft, hoken tech, blockchain, cryptoart, eos, nft art, artificial intelligence, ai, watch authentication, crypto artist, nfts, web3, nft game, web3 game, videogame, nft distributor, videogame blockchain


